- Your power is responsible for Kg ( tonnes) of carbon dioxide equivalent (C02e) emissions
- Your event consumed litres of fuel per person per day (pppd)
- The industry average is 0.58 litres pppd *
- Well done - you are better than the industry average for fuel efficiency by %!
- WVO biodiesel as a percentage of your fuel mix is %
- This is lower than the current average of 15% for festivals engaged with the Industry Green Tool
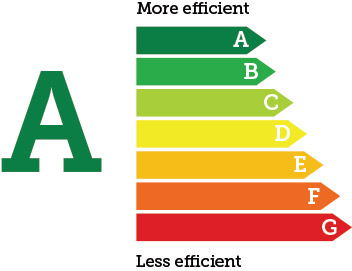
This is your Fuel Tool efficiency rating:
- Well done! You are have achieved the current industry best practice - please get in touch and tell us how you did it!
Save money on fuel and improve your carbon footprint!
There are many ways to reduce fuel consumption – work with users to reduce demand, use energy smart kits like LED festoon and lighting, and design a more efficient system by working with your supplier to get more accurate information in advance. Many events can save 30% on their fuel bill. Find out how to do this using the links below:
- See how other events have done it by exploring case studies HERE
- Explore our series of bite-size energy fact sheets HERE
More about this tool – how does it work?
This tool uses data from the Julies Bicycle Industry Green Tool (Ig Tool) for benchmarking fuel consumption. The data is based on verified fuel consumption from 13 large UK Festivals between 2011 and 2013. The data includes fuel used by concessions. The average fuel use (2014 published benchmark) is 0.86 litres per person per day (pppd) including concession use. Pppd is the unit of comparison.
Carbon ratings for fuel types have been derived from published DEFRA figures - June 2013 Guidelines for Defra / DECC's GHG Conversion Factors for Company Reporting. Solar, waste vegetable oil (WVO), wind and green tariff electricity are zero carbon rated as per the guidelines. Results are calculated as 'CO2e' or 'Carbon Dioxide Equivalent'. This is the universal unit of measurement used to indicate the global warming potential (GWP) of each of the 6 Kyoto greenhouse gases in terms of Carbon Dioxide equivalent impacts. It is used to evaluate the impacts of releasing (or avoiding the release of) different greenhouse gases in a consistent way.
*Your energy rating is calculated by comparing your fuel consumption to the Julie's Bicycle benchmark for outdoor events, using a relative scale of 'per audience day'. Energy consumption in-line with the Julie's Bicycle benchmark will score a rating of D (average of 0.86 litres pppd). Categories are calculated in 25% steps from the benchmark (e.g. category E is 25% less efficient that benchmark, and category by is 50% more efficient than benchmark). This methodology for categories is in-line with Display Energy Certificates, the standard methodology used for ratings nationally such as electrical appliances.
The energy rating is intended to be a guide for comparison only - there are many factors which may affect fuel consumption. The energy rating provided by this tool does not account for kWh's of renewable energy or bottled gas use in the A - G efficiency rating. The rationale for this is various: the aim to keep the process simple and user-friendly, to maintain a focus on the emissions-producing energy component (diesel and virgin biofuel), and to enable working with data which event organisers have readily to hand (i.e. the fuel bill). The tool recognises that diesel is by far the most significant component of energy use currently at events, and thus provides a method for events to specifically focus on their fuel consumption.
Powerful Thinking acknowledges the valuable contributions of the steering group members and others in creating this tool.


